
230 Tribal village census report (PDF) Village wise Census report (PDF) Village information report Village-wise information
__________________________________________________________________________________________________________________________________
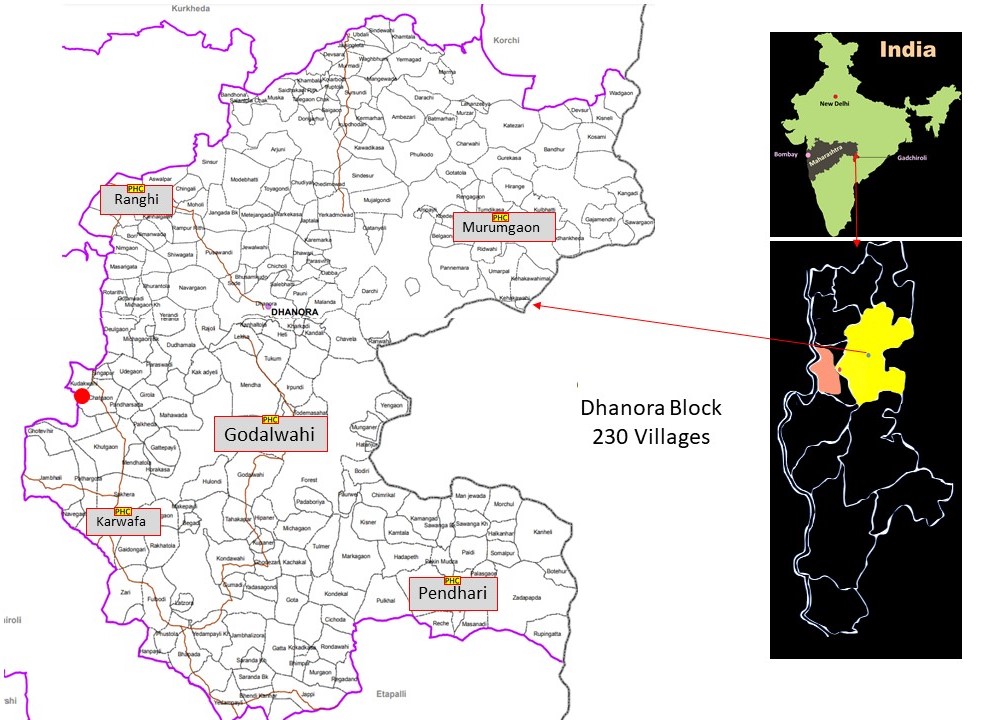
TRIBAL AREA CENSUS REPORT (Dec. 2024)
Executive Summary:
- The average distance to SEARCH from 230 villages in Dhanora block is 37.44km, average distance to Gadchiroli District Hospital was 54.60
km, for villages with no bus stop average distance to nearest ST bus stop is 6.22 km, distance to police station is 9 km. - Out of the 230 villages nearly 84% of villages have a woman self-help group (SHG), 69% have anganwadi in the village, at least 64% villages have any one mobile network, 51% villages have
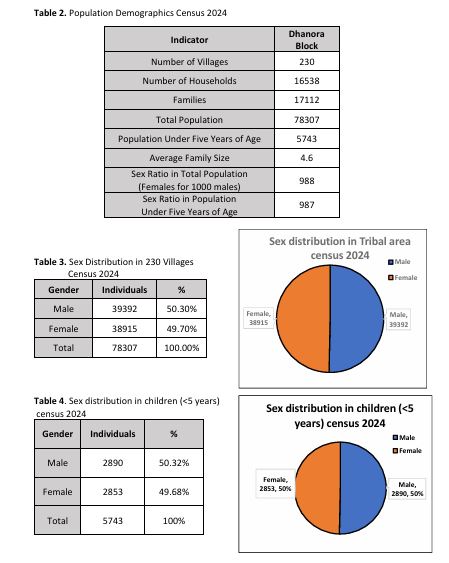
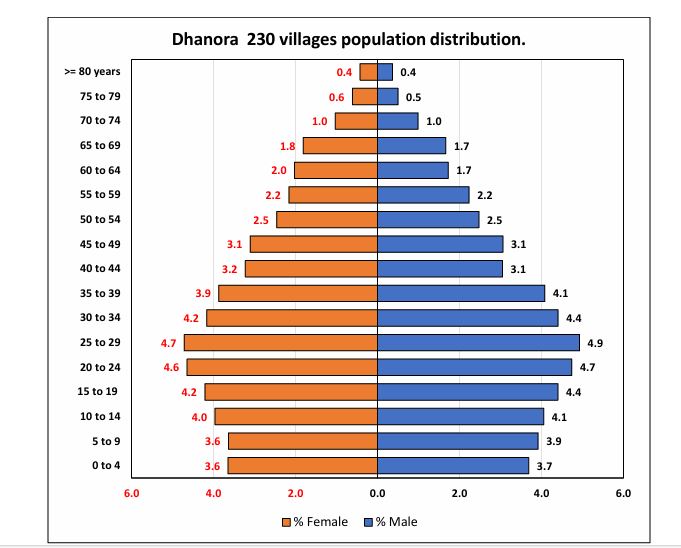
- Population of 230 villages is 78,307 including 39392 (50.30%) male and 38915 (49.70%) females. Out of which the children below 5 years are 5743 containing 2890 (50.32%) male child 2853 (49.68%) female child.
- Total population sex ratio is 988 females per 1000 males and in children age group (<5 years) it is 987 females per 1000 males.
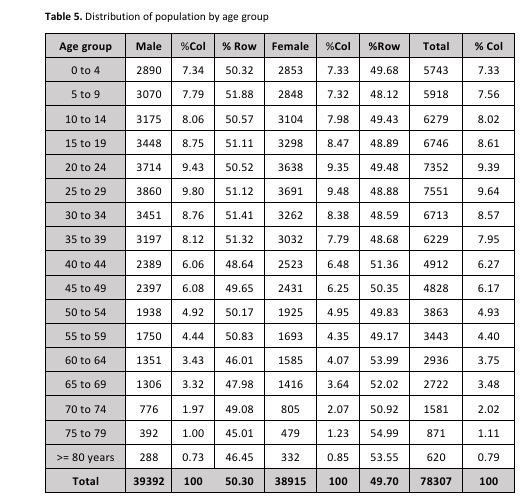
- The largest portion of population6%, fall within 25-29 year age group and the next largest 9.4% is in the age group 20-24 year age group.
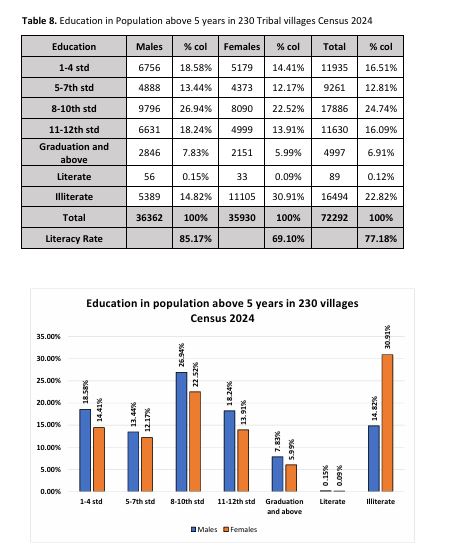
- The educational status of individual over the age of 5 is 22.82% illiterate, 0.12% literate, 16.51% 1st to 4th standard, 12.81 % 5th to 7th standard, 24.74% 8th to 10th standard, 16.09% 11th to 12th standard, 6.91% graduates and above. The Literacy rate of the individuals over the age of 5 is 77% (85% males and 69% females).
- According the 2011 Census, Gadchiroli’s Literacy rate is 74% (66% females and 82% males)
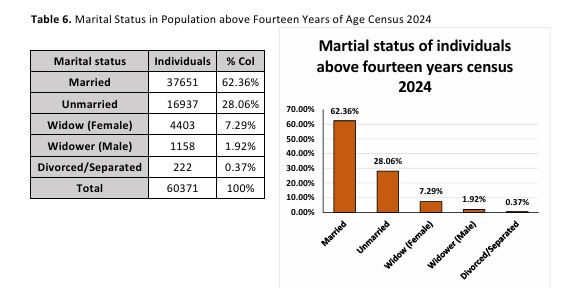
- The distribution of marital status individuals above the age of 14 is 62.36% married, 28.06% unmarried, 7.29% widow, 1.92% widower, 0.37% Divorced.
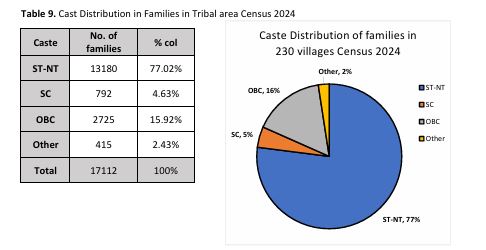
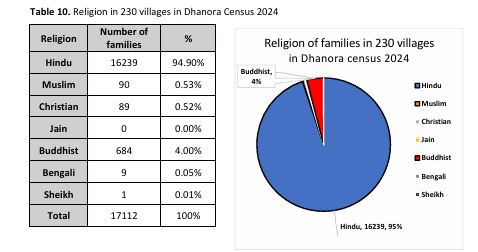
- The caste distribution of households is 77.02% ST-NT, 15.92% OBC, 4.63% SC, 2.43% other. Approximately 95% of households are Hindu, 4% are Buddhist and 1% other.
- The 2011 Census report the SC and ST population to be 11.25% and 38.70% respectively in Gadchiroli.
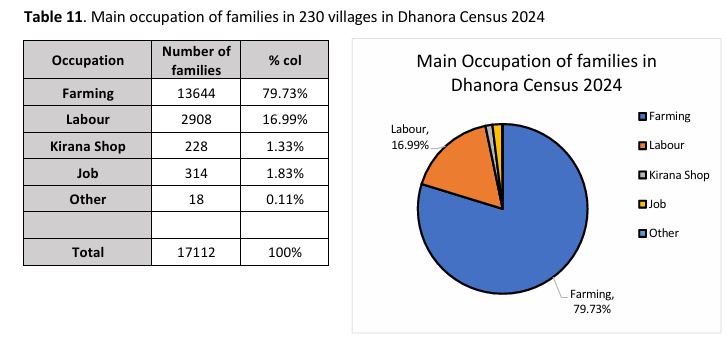
- The main occupation of 79.73% household is farming, 16.99% do labourers, 1.83% have jobs and 1.33 have Kirana shops.
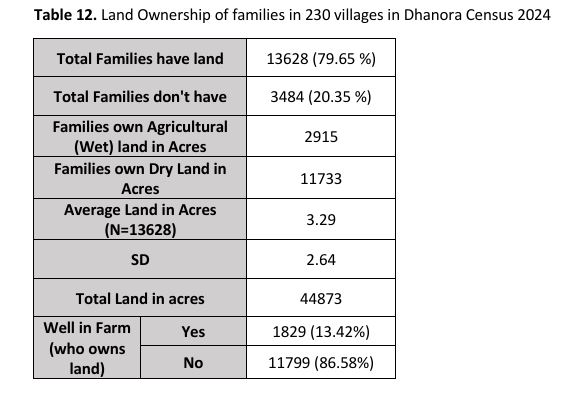
- The average dry and wet land in acres per family is 3.29 acres and 3484 families did not own land.
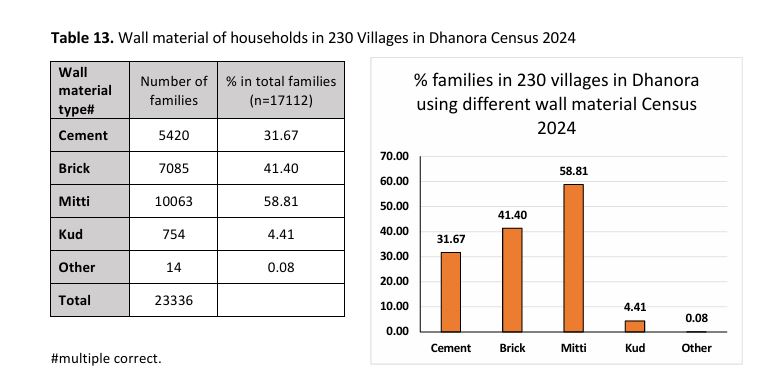
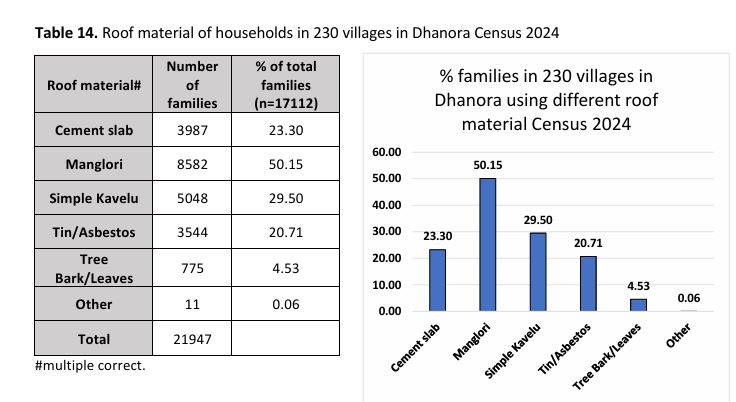
- Almost 59% of household’s walls made up of Matti, 50% of homes had roofs made up of manglori.
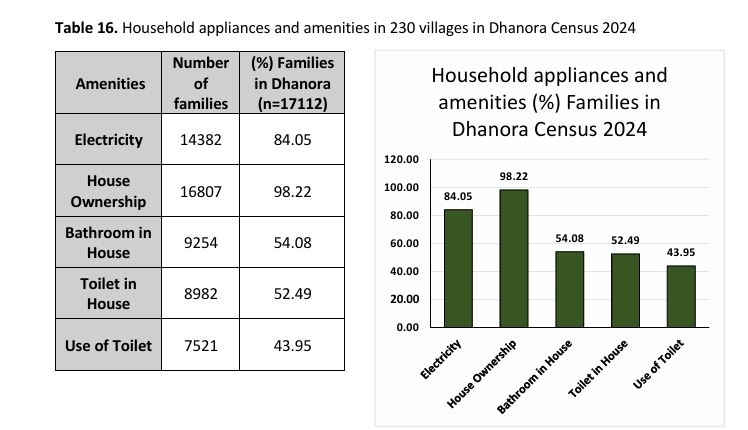
- 05% of all households have electricity, 54.08% homes have bathroom, 52.49% households have toilet and 43.95% of those are in use (functioning toilet).
- According to the 2011 Census, 59.19% of the total district households and 55.34% of the rural households had electricity, 27% of the total population and 22% of the rural households had a latrine facility, 73% of the total households and 78% rural did not have a latrine
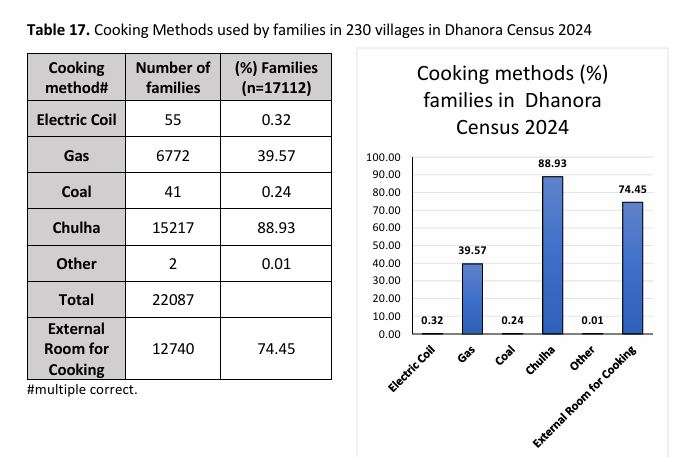
- 89% of households use Chulla as cooking method, followed by LPG used by 39.57% of households, also 74.45% households have external room for cooking.
- The 2011 Census reports 77.08% of total households and 75.8% of rural households having a separate kitchen facility (inside or outside of homes). 83.89% of total households and 89.47% of rural households cooked using a chulha (firewood), 12.62% total households and 7.3% rural households cooked using biogas
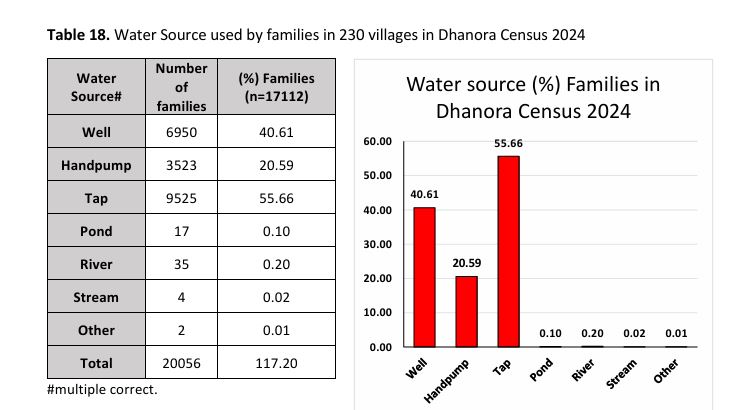
- Tap is the most common water source used by 55.66% households, followed by Well for 40.61% households and lastly Handpump 20.59% of homes.
- The main water source for Gadchiroli district from the 2011 Census for the total population was 39.5% from handpump, 36.27% from wells (covered and uncovered), 13.95% from public tap, 0.33% from rivers and 0.1% from tank/pond. For the rural population the main water source for 43.15% was from handpump, 38.75 from wells (covered/uncovered), 7.87% from public tap, 0.35% from rivers and 0.11% from pond.
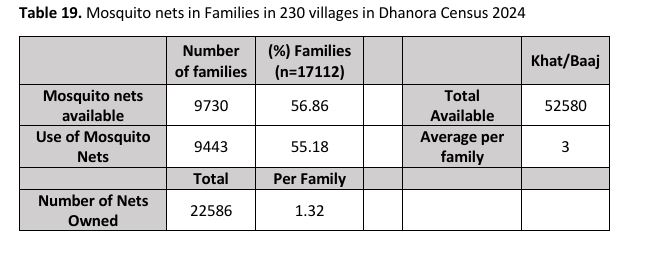
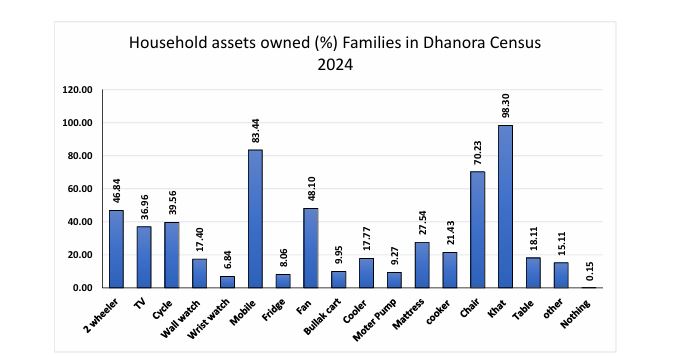
- 86% of families owned at least one mosquito net, with each family owns approximately 1 or 2 nets. Total 52,850 khat/Baaj available with average of 3 per family.
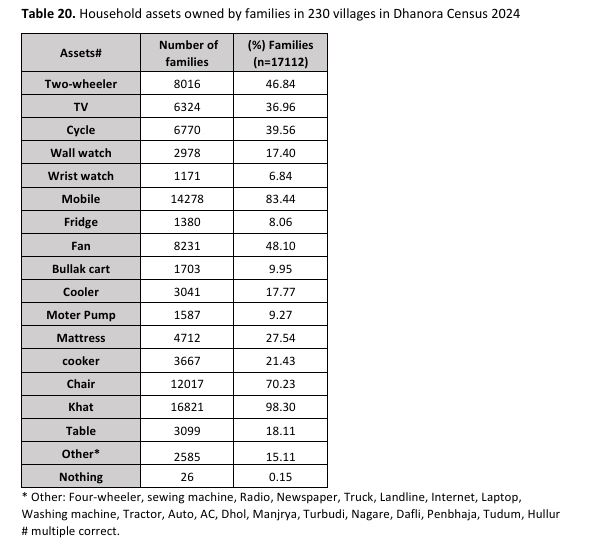
- In the household assets, 83% of families uses mobile while 47% of total household owns two-wheeler. Out of total 37% owns TV, 48% own Fan, 18% own cooler, 9.27% own Motor pump, 2% family owns four-wheeler, only 0.15% households do not own anything.
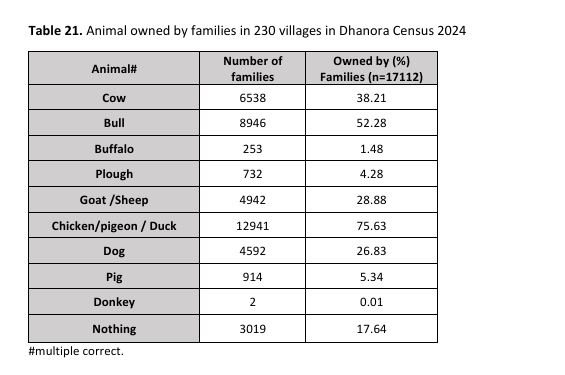
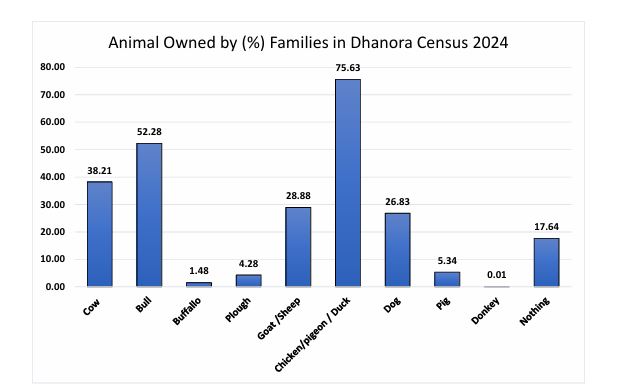
- In the livestock, 38.21% family owns cow,28% owns Bull, 4.28% owns plough, 17.64% family owns no animal/livestock.
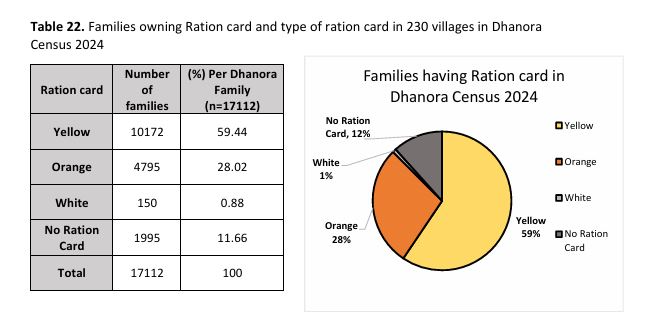
- 88% of families have ration card, out of which 59% have yellow ration card (BPL card) while 28% have orange. 12% percent family don’t have ration card.
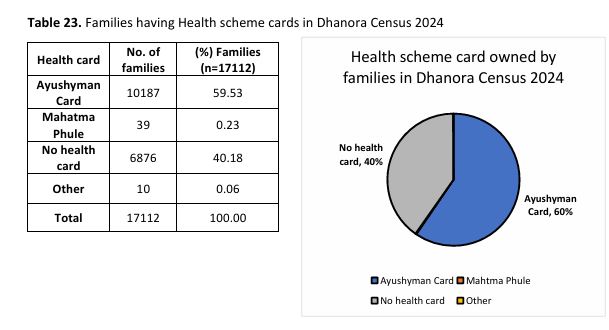
- 60% families have Ayushyaman Bharat health scheme card while 40% don’t have it.
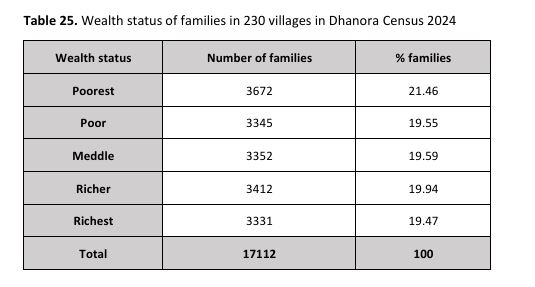
- As per wealth index, approximately 41 % families are Poorest or Poor. While 20% families lies in middle section as per wealth index. The disparity of families as per wealth index seen in areas of supervisors. 40% families are in Poorest section and only 7% are in richest section of wealth index in Maniram Pada area while 10% families are in Poorest section and 32% in Richest section in Rakesh Atla area.
- As per NFHS-5 (2019-20)6% population is in Lowest (Poorest) quintile and 27.9 % population in Highest (Richest) quintile of wealth index in Maharashtra.
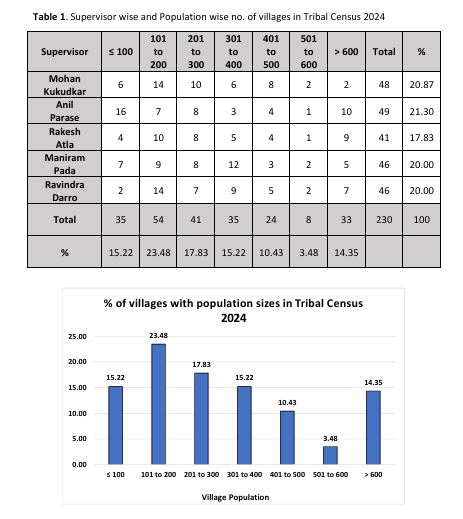
Population wise and Supervisor wise villages in Census 2024:
Population Demographics:
Age Distribution :
Marital Status :
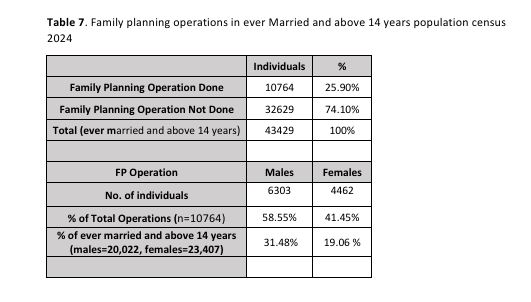
Family Planning :
Educational Status :
Caste Distribution :
Religion:
Main Occupation:
Land Ownership:
House Structure: Wall Material:
 House Structure: Roof Material :
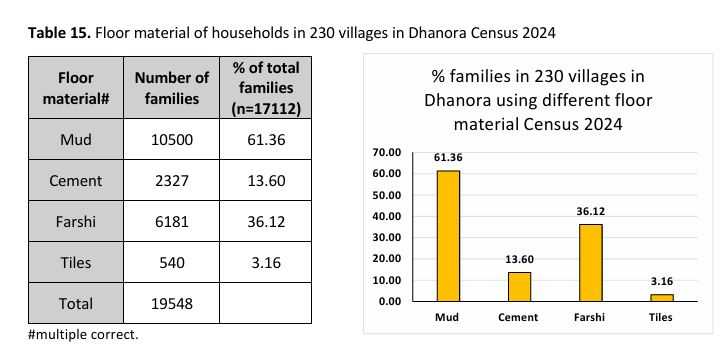
House Structure: Floor Material
Household Appliances and Amenities
Cooking Methods
Water Source
Use of Mosquito Nets and Khata
Household Assets
Animals Owned
Ration card
Health Scheme Card
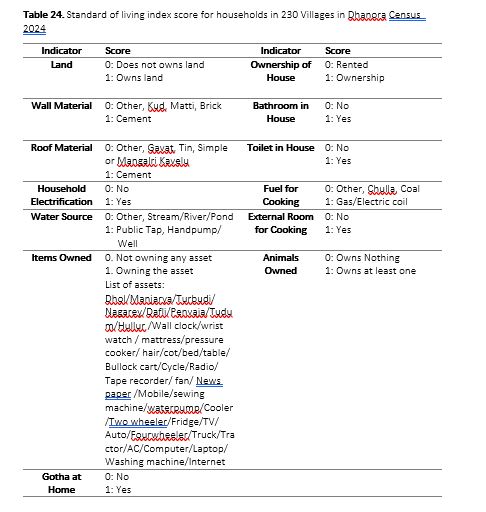
Wealth Index for Household in 230 Villages in Dhanora Census 2024
===============================================================================================================================